14 Subscription KPIs and Metrics to Measure Your Business
 Subscription-first businesses and transactional businesses have different long-term goals, and so your approach to tracking metrics should reflect that.
- Transactional businesses tend to focus on metrics related to bottom-line business growth.
- Subscription businesses focus on metrics related to the customer and the customer experience.
Commonly used KPIs for subscription business growth include monthly recurring revenue (MRR), customer lifetime value (CLV), payback period (PVP), and churn.
We’ve listed 14 KPIs and metrics that are critical for your business. For each, we’ve explained what it is, how to calculate it, and why it is useful.
Numbers 1–9 all focus on metrics for subscription businesses, while 10–14 are transactional business metrics that are still important for subscription companies to track and analyze.
1: Monthly Recurring Revenue (MRR)
Example: $100 (average monthly revenue per subscriber) * 1450 (total subscribers) = $145,000 MRR
Your monthly recurring revenue (or MRR) is the average revenue you earn per subscriber in a month, multiplied by the total number of subscribers. It shouldn’t include one-off revenues.
MRR is a one-step calculation if you have only one subscription plan. However, your business may have multiple tiers. In this case, any plan longer or more expensive than a monthly plan needs to be adjusted accordingly.
For a yearly plan, for example, you need to divide the revenue by 12. If you have custom plans, you’ll have to make additional adjustments.
As the term suggests, MRR shows how much revenue you can expect every month. It’s also a good metric around which to plan sales and marketing efforts.
MRR should grow alongside your subscriber count and is critical to assessing your general trajectory over time. It’s also crucial for calculating other metrics, such as ARR (Annual Recurring Revenue) and ARPU (Average Revenue Per User).
2: Annual Recurring Revenue (ARR)
Example: $100 (average monthly revenue per subscriber) * 1450 (total subscribers) * 12 = $1,740,000 MRR
This is calculated in a similar way to MRR, but serves different needs. It’s useful for creating annual reports or long-term forecasting.
Make sure you don’t include any free trials or other non-revenue generating promotions in this recurring revenue calculation, as it blurs the context of your final result.
3: Average Revenue Per User (ARPU)
Example: $145,000 (revenue from all subscribers) / 1450 (total subscribers) = $100 (ARPU)
Multiple subscription tiers make it difficult to determine how much your average subscriber contributes to your bottom line. Luckily, average revenue per user (ARPU) can help with this.
To calculate ARPU, take your MRR and divide it by the total number of customers.
Here are typical ways ARPU is used:
- Competitor comparison: ARPU can be used to compare yourself with competitors. Many large companies report their ARPU, so look for subscription-based businesses that resemble yours and have achieved sufficient scale. It’s a high-level or macro metric that helps you assess the effectiveness of your pricing structure and upsell strategy over time.
- Pricing strategy evaluation: If your ARPU is lower than expected, it may indicate that most customers are choosing your cheapest plan or not buying add-ons. This could suggest your pricing tiers aren’t well-balanced, or that customers don’t see enough value in higher-priced options. You can use ARPU trends to test new pricing structures or introduce new upsell opportunities to shift the balance.
- Profitability analysis: If you have tiered plans, you can calculate your ARPU for each customer segment. Comparing it with the cost of acquisition or cost of support will tell you just how valuable each customer segment is for you.
You can also track ARPU specifically for new subscribers. This helps you understand how new customers engage with your pricing structure.
If ARPU for new users increases over time, it could indicate that new strategies for upselling, premium plans, or onboarding have been effective and have encouraged higher spending.
4: Customer Acquisition Cost (CAC)
Example: $14,500 (total acquisition costs per year) / 1,450 (total subscribers gained in 1 year) = $10 (CAC)
Customer acquisition cost (CAC) helps you understand if your subscription business is viable. In the long term, you need to spend less on acquiring customers than what you’re earning from them.
Generally speaking, the CAC is calculated by dividing the total amount of cost spent on acquisition activity by the total number of customers acquired in a set period of time.
Costs considered in this usually include:
Marketing costs
- Paid ads (Google, Meta, TikTok, etc.)
- Content creation (blogs, videos, SEO)
- Agency fees (if outsourcing your marketing efforts)
- Marketing software subscriptions (like HubSpot, Ahrefs)
- Influencer partnerships
- Sponsorships
Sales costs
- Salaries and commissions for sales staff
- Software and CRM tools (e.g., Salesforce, Pipedrive)
- Training or consultants
- Sales-related travel or events
Other acquisition-related overhead
- Landing page development and CRO tools
- Email marketing platforms (for prospecting/nurturing)
- Attribution and analytics tools
- Onboarding and support costs tied to converting leads into customers (in some models)
It’s also essential to track CAC for individual channels. This is relatively easy for pay-per-click (PPC) campaigns since there are great analytics for Google, Facebook, Instagram, Twitter, and LinkedIn. But don’t forget that there are also built-in analytics services for Reddit, Quora, comparison websites, and most viable marketing channels.
Calculating CAC is trickier for less direct campaigns, such as SEO, content marketing, and any branding activities, and is therefore harder to track.
When calculating CAC, consider how time factors in. For example, Reddit might be cheaper, but Facebook has a much larger audience. As a result, Facebook will use up a bigger part of your budget, but will also find you more customers faster.
Finally, remember that CAC will change as your company grows. It’ll usually be lower early on, but companies tend to spend more as it becomes harder to acquire new customers.
5: Churn Rate (no acronym!)
Example: 145 (cancellations during period) / 1,450 (customers at beginning of period) x 100 (percentage conversion) = 10% (churn rate for period)
Churn is inevitable, especially for subscription businesses. Your churn rate tells you how many of your current customers you’re losing and how much revenue your business has lost over any meaningful time period.
Effectively, customer churn will tell you how many of your original customers (at a point in time) have unsubscribed. Your customer retention rate is the opposite of your churn rate.
Most businesses aim to keep churn below 4%, but staying on top of all the contributing factors, from difficult-to-use UI experiences to late deliveries, can all contribute.
In fact, our latest churn report found that the median churn rate across all merchants, verticals and models was 7.44%.
Churn is an essential metric to monitor because it costs more to acquire a new customer than to retain one. A good e-commerce platform will have features to help you reduce churn and lower your overall costs.
To calculate churn, take the total amount of cancellations you’ve had during a given period, divide it by the total number of subscribers during the same period, and then convert it to a percentage.
There are two types of churn: voluntary and involuntary.
- Voluntary churn reflects a customer decision. An example could be a customer who chooses to leave, say, due to a price increase.
- Involuntary churn happens when a customer’s subscription ends without them actively choosing to cancel. It’s usually caused by payment issues rather than dissatisfaction.
6: Customer Lifetime Value (CLV), a.k.a. Lifetime Value (LTV)
Example: $100 (ARPU) / 10 (churn rate) * 100% = $1000 (CLV/LTV)
Customer lifetime value (CLV) is one of the most important metrics for subscription-first businesses.
In essence, the higher this number, the greater the perceived value your product has in the eyes of customers. High CLV is often associated with higher spending.
If you’ve been in operation for a while, lifetime value can be seen as how much the average customer earns you from the day they sign up to the day they stop the subscription.
The simplest way to calculate it is to divide ARPU by churn rate.
You can also break down CLV/LTV for each channel. Not all channels yield leads of the same quality, and high conversion rates don’t mean much if the CLV/LTV is low. You can filter out the channels that are working best for you and double down to get the best quality leads.
CLV/LTV and CAC together give you a good estimate of your return on investment or ROI. Just divide the average lifetime value a subscriber brings by the average cost of acquiring one to know how much money you’re making (or losing) for every dollar you spend.
7: Payback Period (PBP)
Example: $10 (CAC) / $100 (subscription cost per month) – $95 (average cost of service) = 2 months (payback period)
An alternative metric to LTV is the payback period. This is the average time it takes for your business to earn back (as MRR) the cost of acquisition (CAC).
This is an important metric because you don’t benefit from acquiring a customer until their subscription revenue is higher than the CAC.
The payback period for a given customer can be calculated by dividing your customer acquisition cost by the difference between the total revenue contributed by the customer within a given time period and the average cost of service (think web hosting and office equipment).
It’s expressed in terms of time, and the ultimate goal is to reduce it.
8: Transactional business metrics
Example: 300 new paid subscribers / 1,000 free trial signups = 30% trial conversion rate
Trial conversion rate shows how effectively your free trial converts users into paying subscribers. It gives you a clear signal of product-market fit, onboarding experience, and perceived value.
To calculate it, divide the number of trial users who become paying customers by the total number of trial signups over a given period.
If you have a low conversion rate, it could be because:
- Your user experience is poor
- The value of your product isn’t being made clear during the trial
- You’re attracting the wrong audience
A high conversion rate, on the other hand, indicates that users understand and want what you’re offering.
To improve trial conversions, ensure users experience key features early, streamline your onboarding, and offer support and reminders when needed.
9: Churn MRR
Example: 15 customers cancel from various plans, resulting in $3,000 in lost recurring revenue that month = $3,000 Churn MRR
Churn MRR is the total recurring revenue lost in a given month due to customer cancellations or downgrades.
It puts a dollar value on how much of your monthly earnings are being lost, not just the number of customers leaving. This helps you understand the financial impact of churn and helps inform your customer retention strategies.
It’s especially useful if you offer multiple pricing tiers, as losing one premium subscriber might impact revenue more than losing several entry-level ones.
You can also calculate gross MRR churn rate by dividing churned MRR by your total MRR at the start of the month. This gives you a percentage view of how much recurring revenue you’re losing.
10: Return on Investment (ROI)
Example: ($10,000 in revenue – $2,500 in costs) / $2,500 = 3 = 300% ROI
Return on investment (ROI) tells you how much profit you’re making for every dollar spent. It’s a high-level metric that helps you decide whether your acquisition, marketing efforts, or growth are paying off.
To calculate ROI, subtract your total costs from your total revenue, then divide by the total costs. Multiply by 100 to express it as a percentage.
In subscription businesses, ROI is especially useful for evaluating specific campaigns or acquisition channels. For example, if a paid ad campaign costs $2,500 and generates $10,000 in revenue, your ROI is 300%.
Don’t confuse ROI with the CLV:CAC ratio. That ratio compares a customer’s worth to the cost of acquiring them. This is useful for assessing long-term sustainability, but not the same as calculating profit from a spend.
11: Quick Ratio
Example: $10,000 in new + expansion MRR / $3,000 in churned + downgraded MRR = 3.3 quick ratio
The quick ratio measures how efficiently your subscription business is growing relative to the revenue you’re losing. It compares revenue from new customers, upgrades, and cross-sells with churned and downgraded MRR over a period.
A quick ratio above 1 means you’re growing, and adding more revenue than you’re losing. A ratio of 4, for instance, means that for every $1 lost, you’re gaining $4. A ratio below 1 signals contraction.
This metric tells businesses whether growth is sustainable. For example, you might be spending to grow, but this might not be translating into increased revenue.
In other words, the quick ratio is a great pulse check on the quality of your growth, not just the speed of it.
To improve your quick ratio, focus on reducing churn and encouraging upgrades or add-ons.
12: Gross Margin
Example: ($120,000 total sales revenue in 1 year – $60,000 costs in 1 year) / $120,000 * 100 = 50% gross margin.
To calculate your gross margin, subtract your total cost of goods sold (COGS) from your total sales revenue, then divide the result by your total revenue. The revenue side is usually straightforward; the harder part is tallying up your costs.
These may include packaging, shipping, customer support, web hosting, and any other expenses directly tied to delivering your product or service.
While gross margin is a key metric for transactional businesses, it’s less central for subscription-first models. That’s because it can be artificially improved by cutting costs or chasing one-off sales; tactics that often run counter to long-term customer retention.
Gross margin tells you something about profitability, but very little about customer loyalty or recurring value.
13: Average Order Value (AOV)
Example: $120,000 worth of orders in 1 year / 1000 orders = $120 average order value.
Average Order Value (AOV) measures how much, on average, a customer spends each time they place an order.
It’s especially important for transactional businesses, where most customers buy once and don’t return. In those cases, the goal is to maximize the value of that one purchase.
For subscription businesses, AOV is less critical. The focus is on recurring revenue, not one-off spend. Still, it can be useful when analyzing upsells, add-ons, or one-time product purchases alongside a subscription.
To calculate AOV, divide your total revenue by the number of orders over a given period.
14: Website Metrics
Website metrics are a double-edged sword in terms of key KPIs for subscription business success.
While metrics like total traffic, session duration, and device type are useful for measuring how useful or interesting your marketing content is, they don’t indicate how many customers you can expect to convert and check out.
For more insight, check out Subbly Expert Alex Fleck’s webinar on subscription conversion hacks for your website.

Tracking Your Subscription Metrics: A Brief Guide to Dashboards
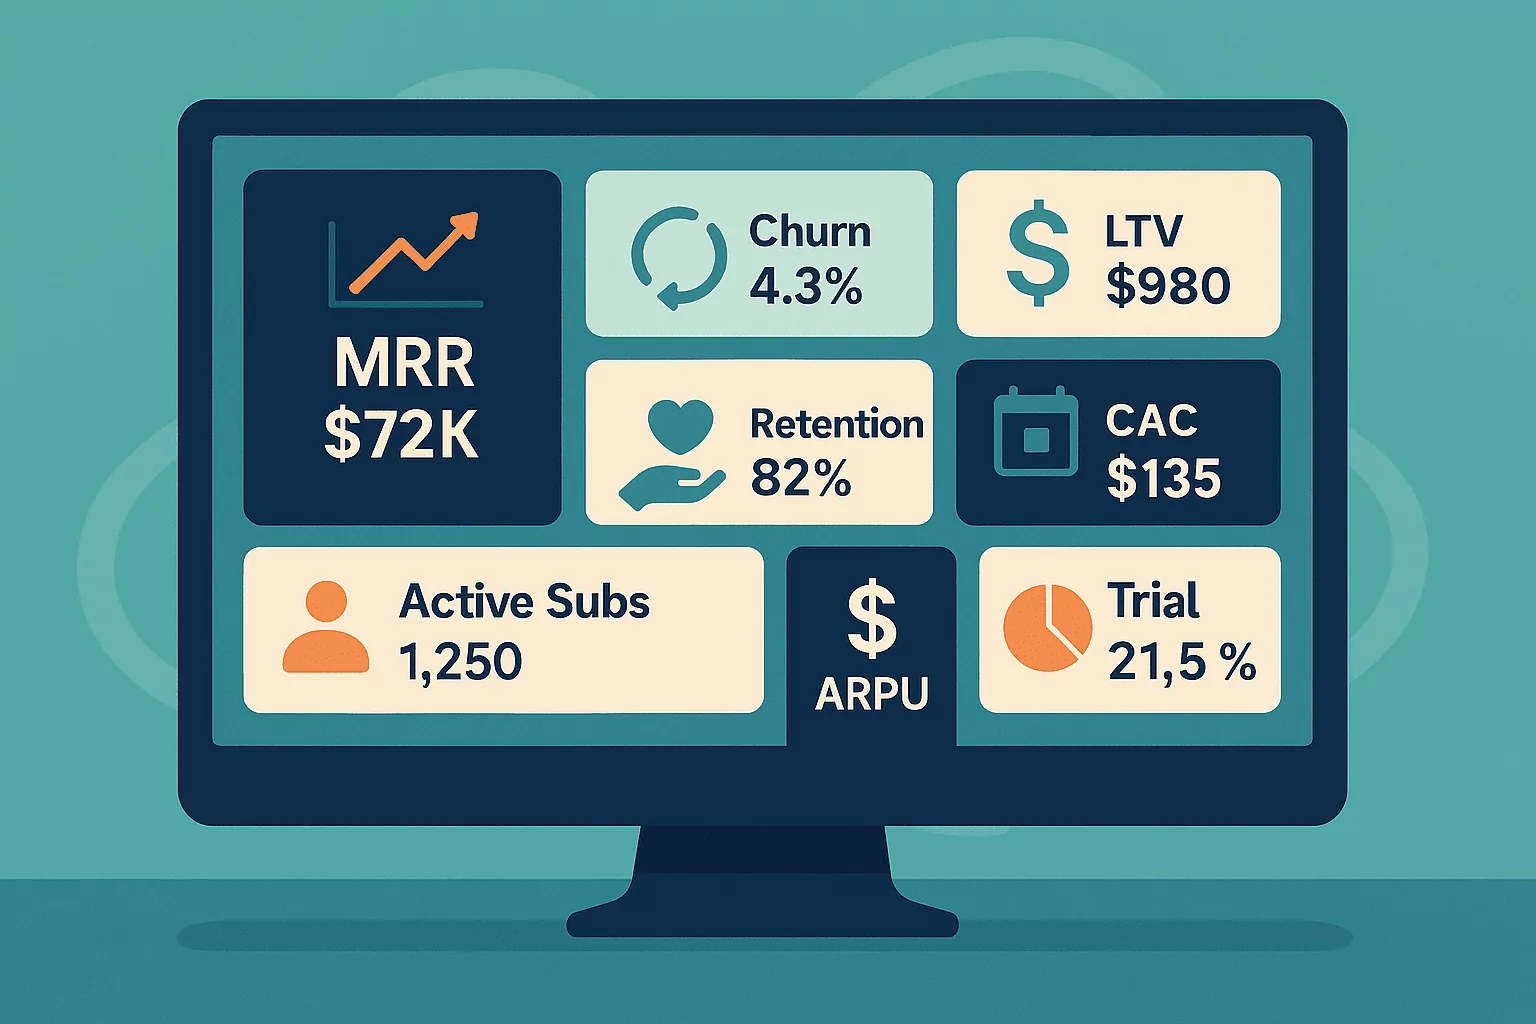
A dashboard, in its simplest form, is something you set up to get a snapshot of all your important metrics in one place.
The easiest way to measure subscription success is to track your metrics by setting up a dashboard in a spreadsheet using a program like Excel or Google Sheets. It’s a pretty simple process:
- Use the columns to set headers indicating the time interval you’re tracking your metrics within, such as calendar week, month, or quarter.
- Use the rows to list your metrics, the variables that go into your calculations, your targets, and the actual numbers you’ve achieved, alongside a formula indicating how far you are from your goals.
- Depending on the tools you’re using to generate your numbers, you might also be able to automatically pull numbers from various other applications into your spreadsheet, removing the need to spend any time manually entering data.
- You can grow or expand your dashboard as your business expands, and create new ones for different contexts and different employees.
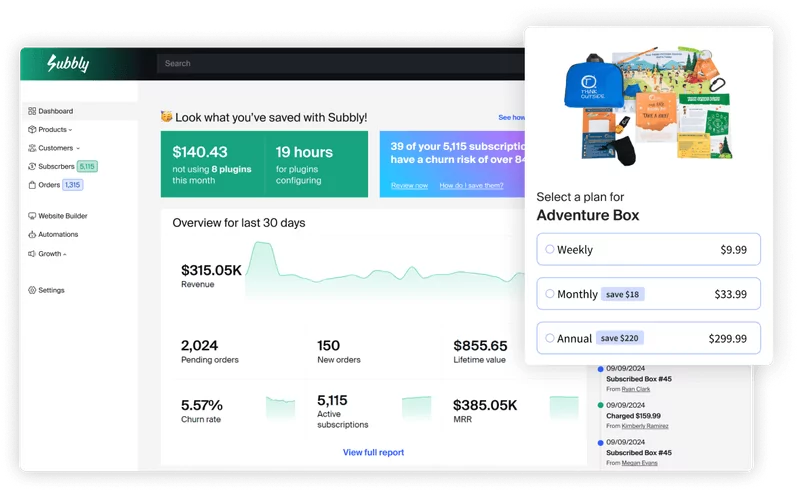
Power Smarter Decisions with Subbly’s Built-in Analytics
Your business isn’t just about creating something cool and hoping people will buy it. It’s about measuring each stage of the customer journey and gradually making informed improvements.
It’s key to understand that subscription model KPIs can be completely different from company to company, and business model to business model.
The right combination of metrics described in this article should be analyzed within the context of your business and used to achieve your goals.
Subscription KPIs show you where your business is today, what problems it could face in the future, and what actions will maximize your chances of success and sustainable growth.
Subscription-first businesses should focus on metrics that track:
- Customer satisfaction
- Conversions
- Churn
- Cost of acquisition
With the right all-in-one platform by your side (like Subbly), accessing this kind of insight will be easier than you’ve ever imagined. Your first 2 weeks are on us, so you can experience for yourself. Try Subbly for free today!
